
The Role of State Estimation in the Improvement of Low Voltage Distribution Network Models
Written by Marta Vanin and Dirk Van Hertem
Digital models of distribution networks are essential for most smart grid applications like system monitoring, congestion forecasts, and hosting capacity calculations, to name a few. However, in real life, these models notoriously present errors or missing information. This has a detrimental impact on both operations and simulation results, which might become unreliable or suboptimal. This article discusses the use of state estimation and residual analysis (in particular) to identify such errors and validate their correction process.
Motivation
The increase of renewable energy sources (RES), electric vehicle chargers, and heat pumps are putting distribution networks at the forefront of the energy transition. While these resources can bring additional stress to the grid, they can also provide end-users with non-negligible amounts of flexibility. The latter can be leveraged to ensure that the system is correctly and safely operated at all times, without investing excessive money in extensive and “blind” distribution grid reinforcement.
The availability of accurate network models is important to develop decision support tools that exploit flexible resources and enable a cost-effective and reliable transition to a RES-based power system. However, in practice, physical features of distribution networks are often poorly known, and digital network models notoriously contain significant errors [1]. This is mostly due to the age of the system and the passive way it has traditionally been managed: when the networks were built, important technical details were not recorded, as technological solutions that could make use of better data were not conceived. Moreover, system changes for operations or management purposes often go unreported. Common data quality issues include wrong or unavailable phase connectivity information [2], impedance values of the used cables [3] and user/meter-to-transformer mappings [4].
State Estimation and Residual Analysis on Measurement Time Series
It is generally recognized that system monitoring is needed for modern grid management paradigms [5], and it is increasingly possible thanks to the ongoing deployment of measurement devices in the grid, like smart meters. State estimation (SE) is a statistical monitoring tool that combines network models and field measurements to calculate the most likely operating condition of the system, filtering random measurement noise. Fundamentally, SE is an optimization process that minimizes the distance between the estimated state variables and their measured values [6]. For each measured variable, the difference between its measurement and estimated value is called residual. Various distance metrics exist, but the most popular one is the weighted sum of all squared residuals. The lower the residuals, the higher the confidence that the state estimate is of good quality.
When SE is used for monitoring purposes, it typically iteratively processes measurements that refer to the same, single time step. Provided that enough redundant measurements are available, statistical analysis on that time step’s residuals can be used to detect and identify gross measurement errors (the so-called “bad data”) and topology errors [7], which typically cause isolated residuals that are much larger than the other ones. In a transmission system SE setting, topology errors typically refer to the erroneous status of switches, which may be (de)activated between two measured time steps, while the network model is not promptly updated [7].
SE has been employed in transmission system control rooms for decades [7]. In the distribution system, it has not reached the same degree of maturity, although the subject has been actively investigated since the 1990s [6]. One of the bottlenecks that hinders the effective application of distribution system SE is the very fact that the existing network model errors compromise its accuracy. These errors are much more common and less sparse than in the transmission system, which makes them more difficult to identify based on a single time step’s residuals.
However, if enough measurements are available, and if SE calculations are performed on measurements time series instead, a cumulative residual analysis can be performed to spot at least some data errors. Furthermore, residual analysis can also be used to validate network model corrections, to assess that the updated model is effectively an improvement over the old one.
Illustrative Example
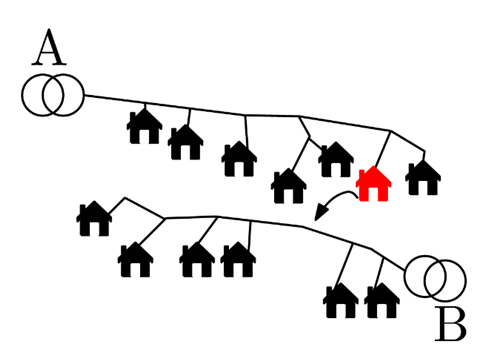
Figure A: example of a possible network data error where a user is assigned to the wrong MV/LV transformer
Take the example illustrated in Figure 1, where the available network data assumes that the red residential user is connected to transformer A, while in reality it is connected to transformer B. For simplicity, assume that there are enough measurements, i.e., the system is observable, and that all users are single-phase and have a smart meter that measures their voltage magnitude (amongst other electrical quantities).
Figure B reports the normalized voltage residuals of the different users over N time steps. Normalized means that they are divided by their weight and reported in Volts. For each user, its residual at each time stamp is one data point in its boxplot. In Figure B (left), one can observe that the residuals for the wrongly allocated user are considerably higher than those of other users. This is because the SE tries to “fit” the voltage variable of the red user to a value which is relatively close to that of the rest of the feeder. However, the voltages in two different feeders can strongly vary, mainly due to tap settings and different loading and unbalance conditions, which is reflected in the measured values. The use of multiple time stamps allows to assess that the higher voltage residual is not a coincidence, but a probable structural error.
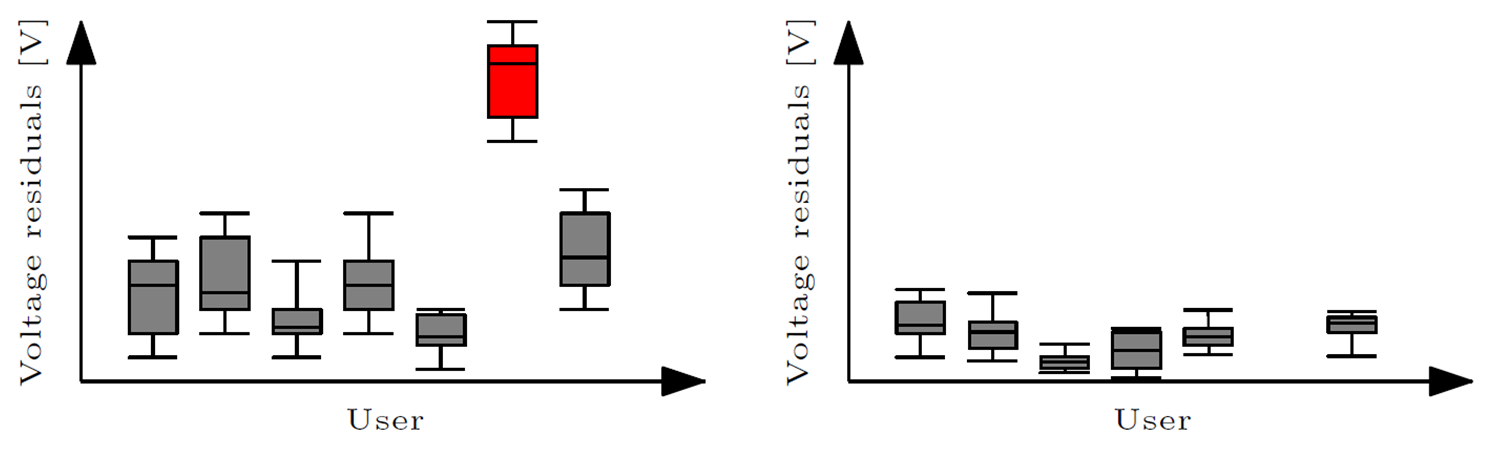
Figure B: illustration of how the error can be spotted by residual analysis (left) and how its correction positively impacts the residuals (right)
If a correction is performed, e.g., by a topology processor, and the user is removed from the model of feeder A and placed to that of feeder B, a positive impact can be observed on the residuals of all other users (and the anomalous residuals disappear). This is because the addition of a wrong user affects the state estimation quality of the whole system, not only of the wrongly connected user.
Conclusion
State estimation is a well-known monitoring tool which can also be used to detect errors in distribution network models. If multiple errors are present, and/or if there are few available measurements, it might not be possible to separate the error sources in the residuals, and SE might have to be combined to other error detection or system identification techniques. Nevertheless, residual analysis can provide valuable insights on the quality of network models, and it allows to statistically validate the applied changes, to assess whether these effectively result in improvements on the previous model. In a real distribution system, this might be one of the few viable, non-intrusive validation mechanisms for network data correction methods.
References
- A. Primadianto, C. Lu, "A Review on Distribution System State Estimation," in IEEE Transactions on Power Systems, vol. 32, no. 5, pp. 3875-3883, Sept. 2017
- [A. Hoogsteyn, M. Vanin, A. Koirala, D. Van Hertem, “Low voltage customer phase identification methods based on smart meter data,” Electric Power Systems Research, Vol. 212, 2022, 108524.
- V. C. Cunha, W. Freitas, F. C. L. Trindade and S. Santoso, "Automated Determination of Topology and Line Parameters in Low Voltage Systems Using Smart Meters Measurements," in IEEE Transactions on Smart Grid, vol. 11, no. 6, pp. 5028-5038, Nov. 2020
- T. A. Short, "Advanced Metering for Phase Identification, Transformer Identification, and Secondary Modeling," in IEEE Transactions on Smart Grid, vol. 4, no. 2, pp. 651-658, June 2013.
- M. C. de Almeida, T. R. Fernandes, L. F. Ugarte Vega, "State Estimation and Active Distribution Networks", Planning and Operation of Active Distribution Networks: Technical, Social and Environmental Aspects", pp. 377-402, Springer International Publishing, 2022
- M. Vanin, T. Van Acker, R. D’hulst and D. V. Hertem, "A Framework for Constrained Static State Estimation in Unbalanced Distribution Networks," in IEEE Transactions on Power Systems, vol. 37, no. 3, pp. 2075-2085, May 2022.
- A. Abur, A. G. Exposito, "Power System State Estimation: Theory and Implementation”, CRC Press, 2004
This article was edited by Mehdi Moghadasi
To view all articles in this issue, please go to October 2022 eBulletin. For a downloadable copy, please visit the IEEE Smart Grid Resource Center.

Marta Vanin received his M.Sc. degree in Energy Engineering from the University of Trento and the Free University of Bolzano, Italy, in 2018. She is now working towards a Ph.D. degree at KU Leuven, Belgium, in the field of decision support to grid operators. Her research interests include distribution network monitoring and system identification/parameter estimation.

Dirk Van Hertem graduated as a M.Eng. in 2001 from the KHK, Geel, Belgium and as a M.Sc. in Electrical Engineering from KU Leuven, Belgium in 2003. In 2009, he has obtained his PhD, also from KU Leuven. In 2010, Dirk Van Hertem was a member of EPS group at the Royal Institute of Technology (KTH), in Stockholm. Since spring 2011 he is back at the University of Leuven where he is an associate professor in the ELECTA group. His special fields of interest are decision support for grid operators, power system operation and control in systems with FACTS and HVDC and building the transmission system of the future, including offshore grids and the supergrid concept.
To have the Bulletin delivered monthly to your inbox, join the IEEE Smart Grid Community.
Past Issues
To view archived articles, and issues, which deliver rich insight into the forces shaping the future of the smart grid. Older Bulletins (formerly eNewsletter) can be found here. To download full issues, visit the publications section of the IEEE Smart Grid Resource Center.
IEEE Smart Grid Bulletin Editors

Managing Editor

Assistant Managing Editor

Interim Managing Editor
IEEE Smart Grid Publications Editorial Board
Mehdi Moghadasi
Mehmet Cintuglu
Geev Mokryani
Jose Medina
Merhrdad Boloorchi
Vigna Kumaran
Hossam Gaber
Jorge Angarita
Ali Nabavi
Vijay Sood
Julio Usaola
Cesar Duarte
Gabriel Ordoñez
Jorge Martinez
Jenny Zhou
Click here for more info
Dr. Panayiotis (Panos) Moutis
Editor-in-Chief
IEEE Smart Grid Bulletin